Of course, things are never that simple.
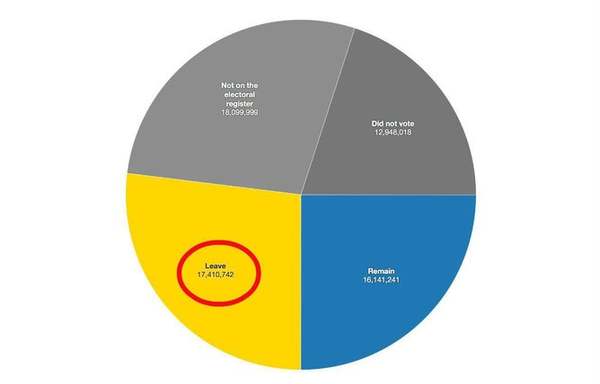
The number of persons not on the electoral register was calculated by subtracting the size of the electorate as of 22 June 2016, from the ONS record of total UK population published on 26 February 2016.
A person may not be on the register by their own choice, or due to ineligibility such as not yet being old enough, being in prison, or not possessing UK citizenship.
EU Citizens living in the UK were ineligible unless they were from Malta, Cyprus, or the Republic of Ireland.
Members of the House of Lords are usually ineligible to vote at UK General Elections, but were allowed to vote in the EU Referendum.
British citizens who had lived abroad for more than 15 years were included in the 'Did not vote' category, as they are on the electoral register but were not permitted to vote in the referendum (nor are they allowed to vote in other UK elections).
In total, the electoral commission reported that the size of the electorate on referendum day was 46,500,001, and 72.1 per cent of that turned out to vote.
This chart is not an entirely convincing argument against Leave or Remain, but it does illustrate that 'the 52 per cent' and 'the 48 per cent' actually constitute much smaller proportions of the UK population than the figure might imply.
www.indy100.com/article/brexit-leave-remain-52-48-per-cent-voter-turnout-electoral-register-charts-7399226

 .
.