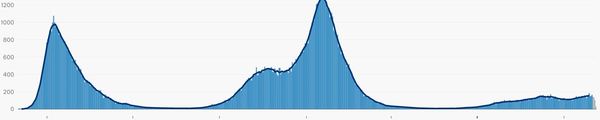
Yes, there's a valley shape and, hopefully, deaths won't reach the heights of the two previous peaks, as a result of vaccinations.
This graph shows UK deaths. There are more details here:
coronavirus.data.gov.uk/details/deaths
You can see the slight increase. You can also see how previous peaks have started. We don't have crystal balls, so we don't know what will happen. Hopefully, vaccinations will keep the increase down, but it still shows that rates haven't decreased, which is what we need.