
twitter.com/Dylan_Difford/status/1748043128693522740
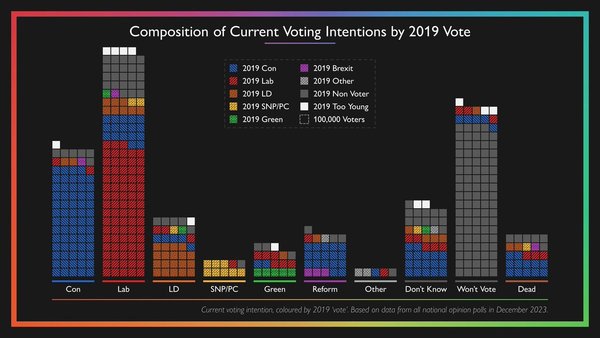
If you enlarge this graph you can see the hight of the column shows the votes in 2019 and the coloured squares show how they intend to vote now.
If someone can add this as a file I would be grateful.
Gransnet forums
News & politics

Join the conversation
Registering is free, easy, and means you can join the discussion, watch threads and lots more.
Register now »Already registered? Log in with:
Gransnet »